Reading guide

You opened the chart. What now?

The About page explains what the chart shows and why it is calculated that way. This page teaches something else: an order of reading. Asking the same questions in the same order on every chart keeps the eye from fixing on whichever line stands out most.

A chart in five steps

Kept short so it can be used on every chart, every time. The tags show which view the information is in.

First: the dates

Before you start, look at the analysis time and the last closed candle under the chart. Zones and the range belong to that time; the time since tells you how current the picture is.

  1. The big picture. On 1W and 1D, which zones or which range is price in? Which way is the structure going?
    Both views
  2. Position. Where is price in the range: the upper half (premium) or the lower half (discount)? How far are the nearest support and resistance? The “Distance” column in the tables gives it as a percentage.
    Both views
  3. Structure. What was the latest event: a BOS or a CHoCH? Where is the protected level, and how close is price to it?
    Price Action
  4. Behaviour. Any sweep in the latest candles? Is price above or below AVWAP? Is there an open FVG nearby? (No FVGs on 1H.)
    Price Action
  5. Detail. Do 4H and 1H tell the same story, or do they disagree with the big picture? A disagreement is not an error but different spans of time telling different stories; know which span your question is about.
    Both views

Using the two views together

Critical Zones and Price Action are calculated independently on purpose; neither uses the other's result. Reading them side by side is like hearing two separate witnesses.

When they point to the same area

If a support band and the range low overlap, two different methods are looking at the same price area. That makes it an area to watch, not proof that it will hold. We have no measurement showing such areas work more often, and we make no such claim.

When they say different things

Questions to ask: Which one comes from the more recent analysis? Am I looking at the same timeframe? Is price inside a zone but in the middle of the range? Often both are right; one describes past reactions, the other today's range.

Real examples

All four examples were taken from the site's charts on 26 October 2026. Each shows the reading as of that date; what happened next will be added in a separate note. They are not a showcase of wins; in one of them the zone was cleared on a close.

1 · A sweep at the low, then a turn

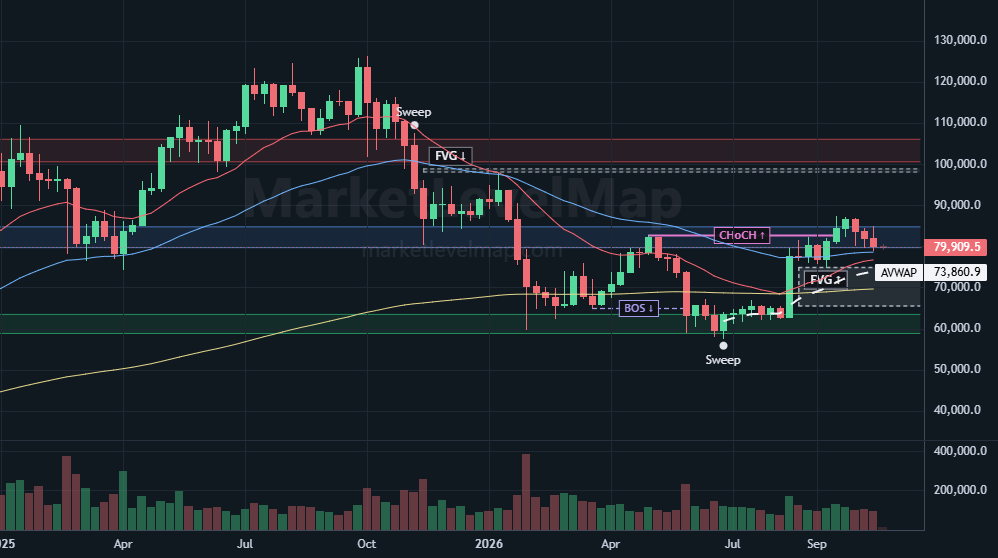
BTCUSDT · 1W · Price Action. Analysis 18 October 2026; last closed candle 19–25 October 2026.

BTCUSDT weekly Price Action chart: range bands, sweep markers, BOS, CHoCH and AVWAP
  1. RH sweep (10 November 2025). A wick went above the range high (107,500) and the candle closed back inside the range. Prices above were not accepted that week.
  2. BOS ↓ (1 June 2026). A close below the latest low at 65,000; the downtrend continued.
  3. RL sweep (29 June 2026). A wick dipped below the range low (57,800) and the close stayed inside. This candle's low will matter shortly.
  4. CHoCH ↑ (21 September 2026). The downtrend's protected high (82,850) was cleared on a close; the structure turned up. The new protected low is the low of sweep 3: 57,800.
  5. AVWAP (73,861). The volume-weighted average price traded since the protected low. Price (≈79,900) is above it: buyers since that low are, on average, in profit.
  6. Position. Price is at the lower edge of the equilibrium (EQ) band, at about 45% of the range, slightly on the discount side.

What it says

The weekly structure has turned up, and price is above the average since the low where the turn began. Price is in the middle of the range, close to neither the range high (≈100,400) nor the protected low (57,800, about 28% below). Questions to follow: Can price stay above AVWAP? Does it close above or below the equilibrium band?

What it does not say

That the uptrend will continue. A CHoCH is a change of direction, not a confirmed reversal; the weekly structure turns down again only if 57,800 breaks on a close, which does not make every drop in between unimportant. Shorter timeframes may be telling a different story over the same period.

2 · Structure intact, buyers under pressure

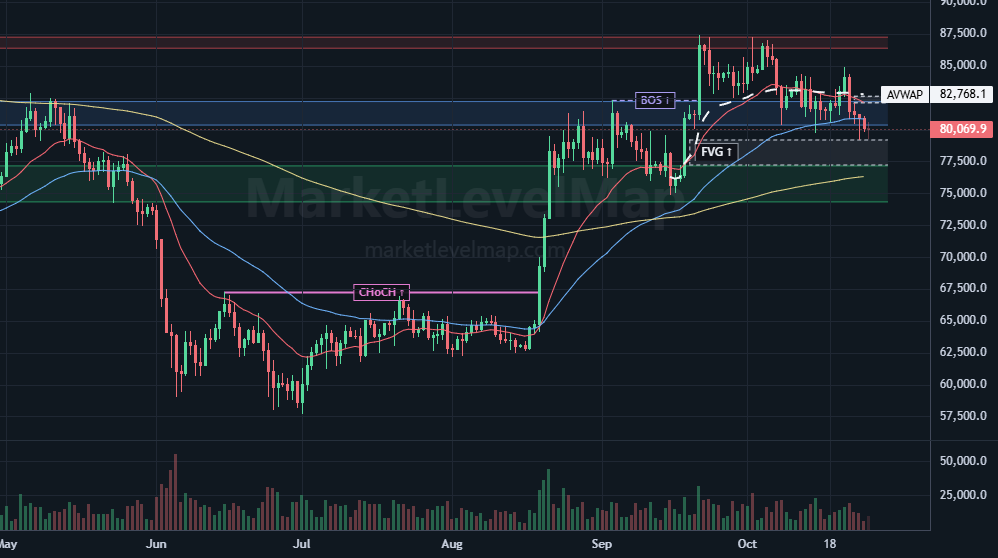
BTCUSDT · 1D · Price Action. Structure and AVWAP as of the 25 October 2026 close.

BTCUSDT daily Price Action chart: CHoCH, BOS, the protected low and AVWAP above price
  1. CHoCH ↑ (19 August 2026). The downtrend's protected high (67,292) was cleared on a close; the daily structure turned up.
  2. BOS ↑ (21 September 2026). A close above the latest high at 82,300; the uptrend continued.
  3. Protected low (15 September 2026, 74,968). The low left by the latest BOS. AVWAP starts here.
  4. AVWAP (82,768). The volume-weighted average price traded since the protected low.
  5. Price (≈80,070). About 3% below AVWAP, just below equilibrium (discount), and about 7% above the protected low.

What it says

The structure is still up; the protected low has not broken. But those who bought since the protected low are, on average, at a loss: price is below AVWAP. Structure and participants are telling different things. Questions to follow: Can price win AVWAP back, or is it heading towards the protected low (74,968)?

What it does not say

Dropping below AVWAP does not mean the structure has broken; only a close through the protected low says that (CHoCH ↓). AVWAP is not a support or resistance zone in itself; it shows the average cost since that point. Price may react when it gets close, but that is not a rule.

3 · Timeframes disagree

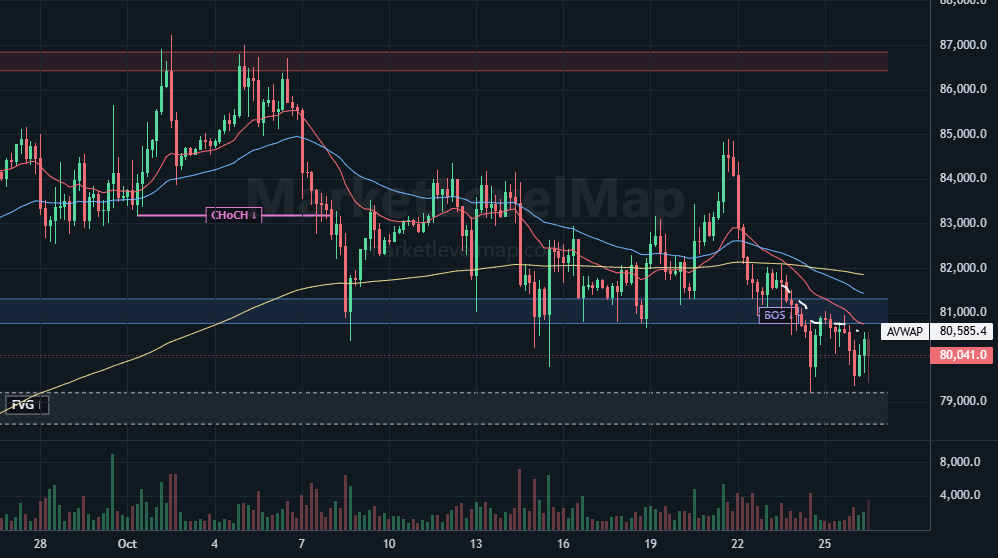
BTCUSDT · 4H · Price Action. Structure and AVWAP as of 26 October 2026, 08:00 UTC. On the same day 1D (example 2) is up.

BTCUSDT 4-hour Price Action chart: CHoCH and BOS pointing down, price below AVWAP
  1. CHoCH ↓ (8 October 2026). The 4H structure's protected low (83,186) broke on a close; the structure turned down.
  2. BOS ↓ (24 October 2026). A close below the latest low at 80,940; the downtrend continued. New protected high 82,061 (23 October).
  3. AVWAP (80,585). The average since the protected high. Price (≈80,040) is below it: sellers since that high are, on average, in profit.

What it says

On the same day 1D is up (protected low 74,968) and 4H is down (protected high 82,061). Both are right: 1D tells the story of weeks, 4H the story of days. For now the 4H downtrend is a pullback within the daily uptrend. There are two boundaries: if 4H closes above its protected high (82,061), the short-term downtrend ends; if the drop reaches the daily protected low (74,968) and closes through it, the daily structure turns too.

What it does not say

Which one will “win”. The answer to “pullback or reversal?” only comes later, at one of those two boundaries. A 4H event on its own should not be read as the end of the bigger trend.

4 · Breakout or false breakout?

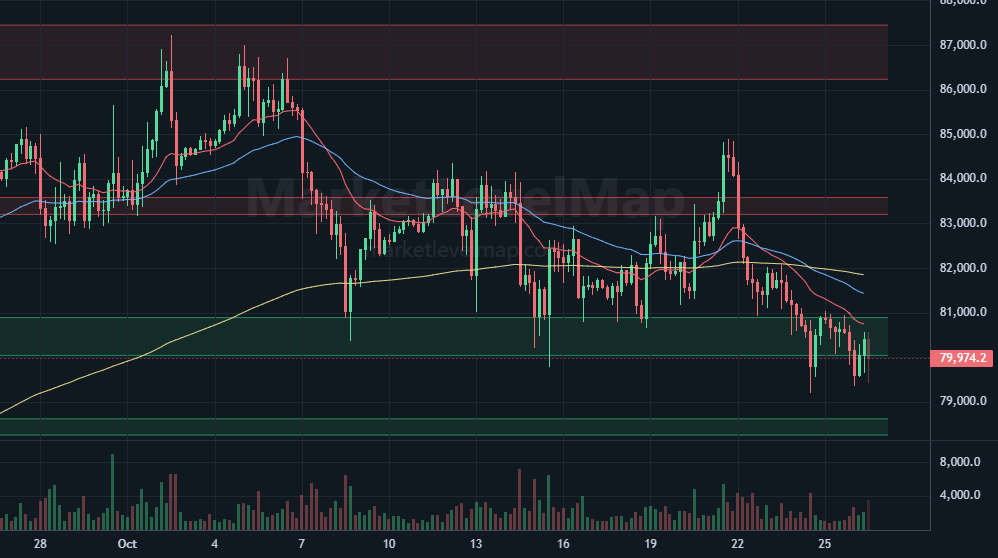
BTCUSDT · 4H · Critical Zones. Analysis 21 October 2026. Support band 80,032–80,901 (formed 5 September 2026).

BTCUSDT 4-hour Critical Zones chart: wicks below the support band with closes back inside
  1. 15 October 2026. A wick went below the band's far edge to 79,800; the candle closed at 82,418, above the band. It was not cleared on a close: a false breakout. The band held.
  2. 24 October 2026, 12:00 UTC candle. This time the close is below the band too: 79,804. Unlike a wick, this is the band being cleared on a close. The next candle closed back inside the band (80,489).
  3. 26 October 2026, 00:00 UTC candle. Another close below the band (79,598). Price then returned inside the band (80,416).

What it says

The same band shows two different situations. On 15 October only a wick went through: prices below the edge were not accepted and the band held. On 24 and 26 October the closes stayed below as well: that is not a wick but a clearance on a close. Because the chart shows the 21 October analysis, the band is still drawn; these closes will be reviewed as a “possible breach” in the next evaluation. A zone is never deleted silently (About: analysis time).

What it does not say

Price returning inside the band does not undo the closes below it, nor does it mean the zone has “recovered”. The re-evaluation decides the zone's future. We chose this example on purpose: not every zone holds, and seeing that on a chart teaches as much as seeing one that does.

When price approaches a zone

The rules for reading a band are on the About page. Here is what each situation says and what it does not, side by side:

SituationWhat it saysWhat it does not say
A wick entered the band, the close stayed outsideThere is a reaction at the zone.That a reversal has started.
The close is inside the bandThe zone is being tested; no decision yet.Which side price will leave on.
A wick crossed the far edge, the close is insidePrices beyond the edge were not accepted; possibly a false breakout.That the zone is now stronger.
The close is beyond the far edgeThe zone has been cleared.That the move will continue; a retest may come.
Broken, retested, and rejected from the other sideRole reversal: the old support behaves like resistance (retest).That the new role will hold.

Common reading mistakes

  • Ignoring the analysis time. Trusting a zone from an analysis weeks old as if it were today's.
  • Taking a single wick for a break. A close beyond the far edge says a zone broke, not a wick.
  • Preferring a 1H event over the bigger trend. A CHoCH on 1H does not change the structure on 1W; it only describes its own span.
  • Treating a zone as a certain turning point. A zone is where a reaction is worth watching for, not a place where price has promised to turn.
  • Reading a CHoCH as a confirmed reversal. A CHoCH says the structure changed direction, not that the new direction will last.
  • Assuming every open FVG will fill. An open FVG is only a gap that has not filled yet; it does not have to.

Short glossary

TermMeaning
RH · EQ · RLRange high, equilibrium, range low: the three bands of the confirmed trading range (ranges and consolidation).
Premium · DiscountThe halves of the range above and below equilibrium.
BOSBreak of structure: a close beyond the latest swing high or low in the trend's direction (BOS).
CHoCHChange of character: a close through the protected level that turns the structure (CHoCH).
Protected levelThe low or high left by the latest BOS or CHoCH that defines the structure's direction.
SweepA wick past a range edge with the candle closing back inside (Sweep).
FVGA price gap left by a sharp move that has not filled yet (FVG).
AVWAPThe volume-weighted average price since the protected level (AVWAP).
SwingA high or low where price changed direction (swing highs and lows).
DO · WO · PWO · MO · YODaily, weekly, previous weekly, monthly and yearly open (About: key levels).
MH · MM · MLMonday high, middle and low.
ATHAll-time high.

Go to the market table → Library →